India's Crypto Tax Visibility Gap: ₹28 Lakh Crore In, ₹511 Crore Out
Parliamentary TDS and income-tax figures show what India's crypto tax net can see onshore. This piece separates activity metrics from taxable records, maps the offshore gap range, and flags what CARF will not fix.
India received roughly $340 billion in crypto-asset inflows between June 2024 and June 2025, the highest absolute figure among major Asian economies in the OECD Asia Capital Markets Report 2026 (Chainalysis-sourced). Media readings put that near 9% of GDP, or about ₹28 to ₹29 lakh crore of activity. In the same broad window, the Government of India reported ₹511.83 crore in TDS on crypto under Section 194S for FY25.
Those numbers are both real and not interchangeable. One measures on-chain activity attributed to India. The other measures tax collected at source on TDS-bearing sales through the domestic (and registered) channel. The gap between them is a visibility story before it is a scandal story.
What the two numbers actually measure
The $340 billion figure (often rounded from Chainalysis country apportionment; some Geography of Crypto readings cite about $338 billion) is crypto-asset value received by addresses linked to India-based users. It includes domestic exchange trading, wallet-to-wallet transfers, self-custody moves, DeFi activity, and some cross-border flows. It is not a balance-of-payments number and does not prove capital left the country. OECD Chapter 5 is explicit that India and Korea led Asia in absolute inflows for June 2024 to June 2025, while Vietnam led when scaled to GDP.
The ₹511.83 crore figure comes from a Finance Ministry written reply in Parliament on 8 December 2025 (reported across Business Today, Economic Times, and Informist as a Lok Sabha answer by MoS Finance Pankaj Chaudhary). It measures TDS collected under Section 194S: 1% deducted on the sale consideration of Virtual Digital Assets (VDAs) where the statutory mechanism applies.
One number is activity. The other is taxable, traceable, onshore sale legs. The interesting question is composition, not the raw ratio.
Hard numbers: TDS under Section 194S
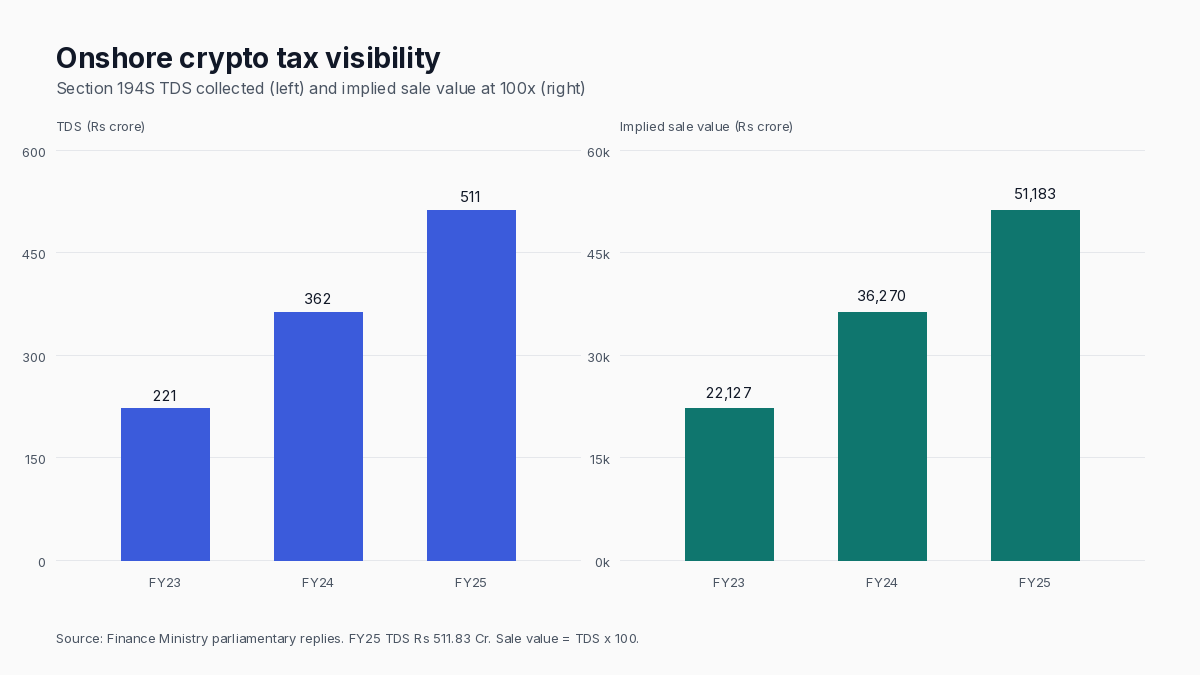
| FY | TDS collected | YoY growth | Implied sale value (100×) |
|---|---|---|---|
| FY23 | ₹221.27 Cr | - | ₹22,127 Cr |
| FY24 | ₹362.70 Cr | +63.9% | ₹36,270 Cr |
| FY25 | ₹511.83 Cr | +41.1% | ₹51,183 Cr |
| Total | ₹1,095.80 Cr | 2-yr CAGR ~52% | ₹1,09,580 Cr |
Source: Finance Ministry parliamentary data, December 2025 (as reported by Business Today / Economic Times).
Section 194S (from July 2022) requires 1% TDS on transfer of VDAs. On an exchange, the platform typically deducts on the sale leg. Multiply collected TDS by 100 and you get TDS-bearing sale value. For FY25: ₹511.83 crore × 100 = ₹51,183 crore.
That arithmetic is certain. True single-counted volume is higher to the extent of threshold exemptions and other non-deduction cases, but the uplift is not quantified in public data.
Why 100× is right and 167× is not
Crypto trading volume is single-counted: one ₹100 sale is ₹100 of volume. TDS is 1% on the sale consideration, so the clean multiplier from TDS to sale value is 100×.
Some coverage (including a Moneycontrol write-up of KoinX data) notes an "effective" TDS rate near 0.60% of turnover, which invites a 167× back-solve (100 ÷ 0.60). That mixes incompatible denominators. Exchange "turnover" can include non-VDA pairs, double-counted legs, or futures/margin notional that does not map 1:1 to 194S consideration. A hard government numerator divided by an inflated, self-reported denominator produces an inflated "effective rate" story, not a better volume estimate.
Sub-1% effective rates versus reported turnover are better explained by:
- Annual thresholds under Section 194S: no deduction where aggregate consideration in the year stays at or below ₹10,000 (payers other than "specified persons") or ₹50,000 (specified persons). These are financial-year aggregates, not per-trade exemptions (Income Tax India, s.194S).
- Refunds and reversals that reduce net TDS without rewriting headline turnover.
- Non-VDA volume inside exchange turnover reports.
- Possible double-counting of buy and sell legs in some turnover definitions.
Confident: ₹51,183 crore is FY25 TDS-bearing sale value. Not confident: any single "true volume" number above that. Direction of bias is upward; magnitude is unknown from public series alone.
Income tax under Section 115BBH
| FY | Income tax collected | Implied declared net gain (÷0.312) | Gain as % of TDS sale value |
|---|---|---|---|
| FY23 | ₹269.09 Cr | ₹862.5 Cr | 3.90% |
| FY24 | ₹437.43 Cr | ₹1,402.0 Cr | 3.87% |
| FY25 | Not yet released | - | - |
Source: Lok Sabha AU13, 21 July 2025. Effective rate used here: 30% under 115BBH plus 4% health and education cess = 31.2%.
Declared crypto profits in FY24 were about ₹1,402 crore. The profit-to-sale-value ratio sits near 3.9% in both FY23 and FY24, computed from two independently reported parliamentary series (TDS replies vs income-tax replies). That convergence is an internal consistency check on the onshore, reported market. It does not prove offshore profit levels.
India also ranks first in the Chainalysis 2025 Global Crypto Adoption Index for a third year, including first place across the published sub-indices. High adoption with a small declared profit base is compatible with loss years, non-reporting, offshore routing, or all three. The data cannot pick a single cause.
State-wise TDS is a registration map
FY25 state shares from the same December 2025 parliamentary disclosure:
| State | TDS (FY25) | Share |
|---|---|---|
| Maharashtra | ₹293.40 Cr | 57.3% |
| Karnataka | ₹133.94 Cr | 26.2% |
| Delhi | ₹28.33 Cr | 5.5% |
| Rest of India | ~₹56 Cr | ~11% |
Maharashtra and Karnataka together are about 83.5% of collections. Delhi jumped from ₹0.99 crore in FY24 to ₹28.33 crore in FY25 (about 28×), still only mid-single digits of the national total.
The headline "crypto is concentrated in two states" is usually wrong as a behavioural claim. Section 194S attribution follows the deductor, and major domestic exchanges are registered in Mumbai (Maharashtra) and Bengaluru (Karnataka). Hindustan Times itself frames the lead as tax from exchanges based in Maharashtra. A trader in Guwahati on a Mumbai-registered exchange still shows under Maharashtra. Treat the map as a corporate-registration artefact, closer to "NSE is in Mumbai" than to "all equity investors live in Mumbai."
Delhi's jump is worth watching (new or ramped Delhi-registered deductors), not as proof of a sudden NCR trading boom.
Offshore migration: ranges, not a point estimate
| Source | Period | Offshore share | Summary |
|---|---|---|---|
| KoinX (Moneycontrol) | FY25 | 72.66% | Tax-filing user sample; ~₹51,252 Cr offshore of ~₹70,536 Cr total |
| TIOL-TKF | Oct 24 to Oct 25 | ~91.5% | Market-wide model; ~₹4.87 lakh Cr offshore in the annual window |
| Esya Centre | Since Jul 2022 | n/a | ~₹6,000 Cr cumulative uncollected TDS (older impact assessment) |
Sources: KoinX / Moneycontrol, TIOL-TKF PDF, Esya Centre PDF.
KoinX users are people already in a tax-compliance workflow. That biases down the measured offshore share relative to the full population. Treat ~73% as a floor for that sample family, not a national census. TIOL-TKF's ~91.5% is a ceiling-style market model. The two are not interchangeable.
Sensitivity anchored on the hard ₹51,183 crore onshore TDS sale base:
Offshore sale value ≈ ₹51,183 × (share ÷ (1 − share))
| Scenario | Offshore share | Offshore sale value | Uncollected TDS (1%) | Gap ÷ collected |
|---|---|---|---|---|
| Floor | 72.66% | ₹1,36,026 Cr | ₹1,360 Cr | 2.7× |
| Mid | 82.0% | ₹2,33,167 Cr | ₹2,332 Cr | 4.6× |
| Ceiling | 91.5% | ₹5,50,970 Cr | ₹5,510 Cr | 10.8× |
The function is nonlinear: a 19-point move in share (72.66% to 91.5%) roughly quadruples implied uncollected TDS. Argue about the share, not a false-precision rupee headline.
Cumulative estimates since July 2022 run roughly ₹6,000 to ₹11,000 crore of uncollected TDS across Esya and TIOL-TKF. Even the floor is several times the ₹1,095.80 crore actually collected over three years. These remain models.
Why traders left the TDS net
The 1% levy is a transaction tax on sale consideration, not a tax on profit. A loss trade still pays TDS. High-frequency round-trips accumulate friction quickly. Offshore platforms that do not deduct 194S became the economic exit.
PMLA obligations for VDA service providers (from March 2023) are activity-based, not presence-based: serving Indian users triggers AML duties even without a local office. FIU-IND issued show-cause action to 9 offshore VDA SPs in December 2023 and to 25 more on 1 October 2025, with app/URL blocking directions (PIB, 1 Oct 2025; Economic Times).
Asymmetry: PMLA can reach offshore; Section 194S, as administered, does not compel the same platforms to deduct and deposit TDS. That reach gap, not the headline 1% alone, is the structural tax-visibility problem. TIOL-TKF recommends amending 194S to cover platforms serving Indian users regardless of registration.
Enforcement: detection is not recovery
GST: Parliament was told of ₹824.14 crore detected GST evasion across crypto exchanges, with ₹122.29 crore recovered (~14.8%). Reporting around that reply attributes the bulk of the detected amount to Binance / Nest Services, with recovery from that slice reported as nil (GST Press / Business Standard summary). Treat the ₹824 crore line as heavily single-entity, not as a uniform industry average.
Income tax: broader VDA searches/surveys reported ₹888.82 crore undisclosed income; surveys on three exchanges found ₹39.8 crore TDS non-compliance and ₹125.79 crore undisclosed income (Business Today). Coverage of the platform population remains thin. Extrapolating a three-exchange base rate to the full registered set would be speculative; the coverage ratio is the cleaner point.
What $340 billion does and does not prove
Chainalysis-style country estimates typically combine address attribution, clustering, and web-traffic (or similar) apportionment of exchange volumes to countries. Attribution and clustering can be strong. Country apportionment is a proxy: traffic share is not value share; VPN use biases geolocation; multi-hop flows can inflate "value received"; domestic wallet moves count without any BoP outflow.
Use the adoption ranking as the robust claim. Use the dollar figure as a scale illustration only. A ranking can survive proxy noise that a precise USD total cannot.
Deceleration signal
| FY | TDS growth |
|---|---|
| FY24 | +63.9% |
| FY25 | +41.1% |
Onshore TDS growth is slowing while APAC crypto transaction value rose about 69% YoY to $2.36 trillion in the twelve months to June 2025 (Chainalysis / regional reporting echoed in OECD Chapter 5). Divergence is consistent with incremental growth landing outside the 194S net. It is a signal, not a proof.
Illustrative FY26 TDS paths if you force a single growth assumption onto FY25's ₹511.83 crore base (not forecasts):
| Case | Growth | FY26 TDS | Sale value | Gap (91.5% offshore) |
|---|---|---|---|---|
| Conservative | +20.6% | ₹617 Cr | ₹61,727 Cr | ₹6,645 Cr |
| Momentum | +41.1% | ₹722 Cr | ₹72,219 Cr | ₹7,774 Cr |
| High | +52.1% CAGR | ₹778 Cr | ₹77,849 Cr | ₹8,380 Cr |
Prefer ranges over any one cell.
Four-tier visibility frame
Tier 1: Collected and official
₹1,095.80 crore TDS (FY23-FY25) plus ₹706.52 crore income tax (FY23-FY24). Court-citable parliamentary totals.
Tier 2: Detected, not fully recovered
GST detection ~₹824 crore (recovery ~₹122 crore); undisclosed income detections in the high hundreds of crores to ~₹1,000 crore+ across related reporting. Investigation findings, not adjudicated revenue.
Tier 3: Modelled offshore gap
Roughly ₹1,360 to ₹5,510 crore per year of uncollected TDS under the share scenarios above; cumulative models ~₹6,000 to ₹11,000 crore since July 2022. Reproducible from assumptions; only as good as the share.
Tier 4: Structurally invisible
DeFi, many DEX flows, pure P2P, and self-custody paths with no obligor to deduct TDS or file exchange statements. Reporting frameworks that bind intermediaries do not bind protocols.
What 2026-2027 changes (and what it does not)
- 1 April 2026: Crypto-asset information reporting (Section 285BAA under the 1961 Act; carried forward in the re-codified Act) takes effect for prescribed reporting entities. Broader "crypto-asset" language; better Tier-1 granularity for entities inside the net. Does not, by itself, fix offshore 194S collection.
- Budget 2026: Left the 30% gains tax and 1% TDS unchanged; added reporting penalties (₹200/day for non-filing; ₹50,000 for inaccurate/uncorrected information) aimed at reporting entities (CoinDesk). Tightens compliance for entities already in scope.
- 1 April 2027: OECD CARF exchange of crypto information among committed jurisdictions is the planned big step for foreign-exchange visibility. It still binds reporting entities, not DeFi/DEX/P2P/self-custody.
- Residents already face foreign-asset disclosure duties (including Schedule FA) and Black Money Act exposure for undisclosed foreign assets. Detection still depends on data; CARF is meant to supply more of it for exchange-intermediated activity.
The government's own limits
In Lok Sabha AU13 (21 July 2025), the Ministry stated:
- No official estimate of revenue lost to under-reporting of VDA/crypto income.
- No real-time automated matching of VASP TDS information with taxpayer ITRs; analysis is later, via data analytics (including NUDGE campaigns where TDS exists but Schedule VDA reporting does not).
Every private gap estimate, including this one, works inside that incompleteness.
Four structural takeaways
- State-wise TDS maps deductors, not traders. Using it for geographic adoption claims is a methodology error.
- TDS is a visibility instrument before it is a revenue instrument. Lose the onshore deductor and you lose the named record that makes matching and audit possible.
- PMLA already reaches offshore service of Indian users; 194S does not mirror that reach. Closing that statutory asymmetry is the clearest tax-code lever discussed in the TIOL-TKF line of work.
- Enforcement headlines need entity decomposition. Large detected GST amounts can be dominated by a single group; recovery rates tell a different story from detection totals.
Bottom line
The onshore, TDS-bearing market for FY25 is about ₹51,183 crore of sale value and ₹511.83 crore of TDS. Activity metrics near $340 billion describe a different construct. Offshore share models imply additional sale value on the order of ₹1.4 lakh crore to ₹5.5 lakh crore in the sensitivity table above, with uncollected TDS several times what was collected. Tier-4 activity has no clean public number.
What is coming (285BAA/reporting penalties in 2026, CARF in 2027) improves exchange-intermediated visibility. It does not abolish the structural ceiling created by non-intermediated crypto. The policy question is how much of the gap is closable with reach and reporting, and how much is inherent to the technology.
How much of India's crypto market can the tax system actually see? Start with ₹51,183 crore of FY25 TDS-bearing sales. Everything above that is model, ranking, or estimate.
Disclaimer: Based on publicly cited parliamentary replies, OECD and Chainalysis materials, and secondary reporting linked above. Not tax, legal, or investment advice.
Key sources
- Lok Sabha AU13, 21 July 2025 (income tax FY23/FY24; no official loss estimate; no real-time ITR-TDS matching): Sansad PDF
- Finance Ministry TDS series and state break-up, December 2025 parliamentary reply: Business Today, Economic Times
- OECD Asia Capital Markets Report 2026 (crypto chapter; Chainalysis inflows): OECD PDF
- TIOL-TKF, Taxation of Digital Assets in India (Nov 2025): PDF
- FIU-IND notices to 25 offshore VDA SPs, 1 Oct 2025: PIB